

The goal of adding a graph cursor is to find the exact values of a point along the plotted graph, the next example contains a graph of a simple parabolic curve, clicking anywhere on the graph will snap to the nearest point on the graph and show the values on the designated numeric controls.
To add a graph cursor you need to do the following 2 steps :
1. Adding the Graph Cursor
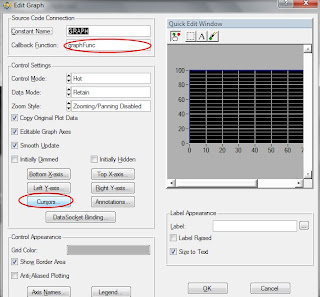
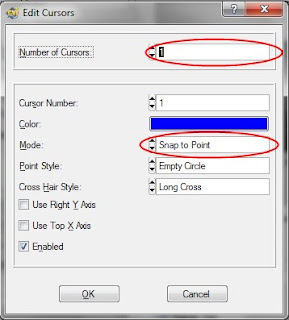
- At the .uir tab of the workspace edit the graph control and click the Cursors button.
- Change the number of cursors to 1 and the mode to "Snap to Point".
2. Showing the Graph Cursor Values
- At the edit graph window enter a callback function ("graphFunc") and click OK to exit and save changes.
- Generate the callback function.
- Go to the .c tab at the workspace and locate the callback function.
- Define 2 double variables in order to store the graph cursor values.:
- Assign the graph cursor values to the variables:
- Assign the variables values to a numeric controls:
SetCtrlVal (panelHandle, PANEL_NUMERIC_Y, y);
Awesome I love this!
ReplyDeletethis is great
ReplyDeleteAwesome I love this!
ReplyDeleteAwesome I love this!
ReplyDeletethis is great do you mind if I share it?
ReplyDelete